
Formerly PARASCADD
Formerly PARASCADD
APEXMIS
Project & Production Analysis, Portfolio, Dashboards
- On Cloud
- On Premise

APEXMIS enhances project management for all industries, boosting efficiency, reducing costs, and providing greater visibility and control.
APEXMIS: Project Management Dashboards and Reports for Every Industry
APEXMIS is a powerful project management platform that provides graphical interactive analytical dashboards and reports for all functions of a project, including schedule and cost performance, risk, HSE, quality, and finance. It can be used during all phases of execution in a wide range of industries, including infrastructure, oil and gas, petrochemicals, offshore platforms, fertilizers, pipelines, and infrastructure.
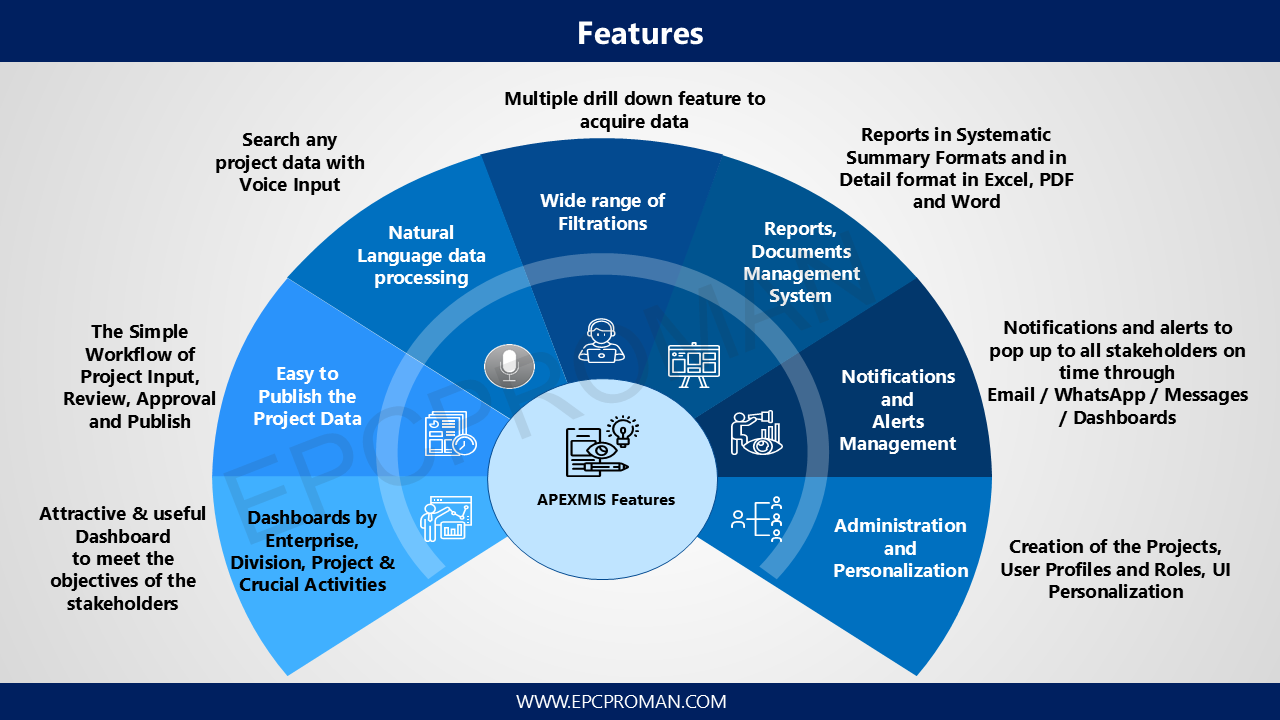
Features of APEXMIS
- Unit-level and project dashboards provide a clear summary of key milestones, overall progress, and team performance.
- MIS reporting is customized based on industry, location, and other criteria for informed decision-making.
- Data analysis and reporting are available in multiple formats, including pie charts, histograms, scatter plots, ring charts, and profile curves.
- Project progress and performance matrices, exception lists for delays, 90-day lookaheads, and color-coded status bars (green/yellow/red) highlight issues needing attention.
- High-level progress charts display completed and remaining tasks across projects.
- Stakeholders and project owners can post updates and track all active projects from a single dashboard.
Benefits of APEXMIS
- Improved company performance and faster decision making achieved by using streamlined ApexMIS data visualization techniques.
- Transforms company data into real time data metrics rich visuals
- Generates the reports in the understandable formats and usable to all hierarchical levels of people
- Document centralization and accessible to download to authenticated peoples with just one click
- Project progress card as of calendar date on one click
- Progress data comparison while recording, reviewing and approving
Better data management means better decision making
- APEXMIS is a web-based software application for recording, analyzing, and reporting project progress data.
- APEXMIS can be used for projects in various sectors, including Oil and Gas, Petrochemicals, Manufacturing, and Construction.
- APEXMIS produces data in an understandable format using graphs and charts.
- APEXMIS is useful for project stakeholders to view and monitor project progress.
- Schedule and Cost performances are key controlling functions for progress measurement.
Features
-
Interactive Dashboards for EPC Projects
APEXMIS offers intuitive dashboards using modern data visualization tools to present key project milestones at both unit and overall project levels
-
Customizable MIS Reporting
Generate MIS reports in industry-specific templates, with filters for geographic location, schedule performance (ahead/delayed), and budget status (within/overrun)
-
Visual Data Analysis
Analyze project data using visual formats like profile curves, pie charts, histograms, ring charts, scatter plots, and other graphical tools
-
Project Performance Monitoring
Track overall progress and highlight issues needing attention through exception lists, 90-day look-ahead views, and earned value indicators
-
Unified Project Overview for Stakeholders
Provide stakeholders with real-time updates on project health using color-coded status bars, task completion charts, and owner-posted status updates—all from a single dashboard
Core Capabilities
Comprehensive MIS Reporting: APEXMIS supports top-level management by providing detailed reports on project physical and financial progress, cost and schedule overruns, and variances.
Visual Representation of Metrics: Key monitoring parameters are displayed using visually engaging charts and curves for better understanding and quicker decision-making.
Advanced Data Interaction: Features like drill-down, slice-and-dice enable in-depth analysis of project data from multiple perspectives.
Sector, Client, and Location-wise Monitoring: Projects can be tracked based on sector, client, or location, with GPS-enabled map integration for geographic visualization.
Dynamic and Graphical Insights: APEXMIS delivers pre-analyzed data in a graphical format, rendered dynamically to reflect real-time project status.